Global Street Tree Diameter Growth Monitoring
Measuring street tree trunks year after year in historical street view imagery to track how fast city trees grow.
Street trees cool streets, store carbon, and make neighborhoods healthier, but few cities can afford to measure every trunk again each year. Street view cars, however, have photographed the same streets many times for more than a decade. This project turns that photo archive into a growth record for every street tree: find each trunk, measure its diameter at breast height, and follow the same tree from one year to the next.
How it works
- An AI segmentation model outlines each tree trunk in street view photos.
- The camera position and viewing direction of two photos locate the trunk by triangulation. The trunk’s width in the photo and its distance from the camera then give its diameter.
- Photos of the same trunk from different camera positions and years are grouped into one physical tree, which yields a yearly diameter and a growth rate.
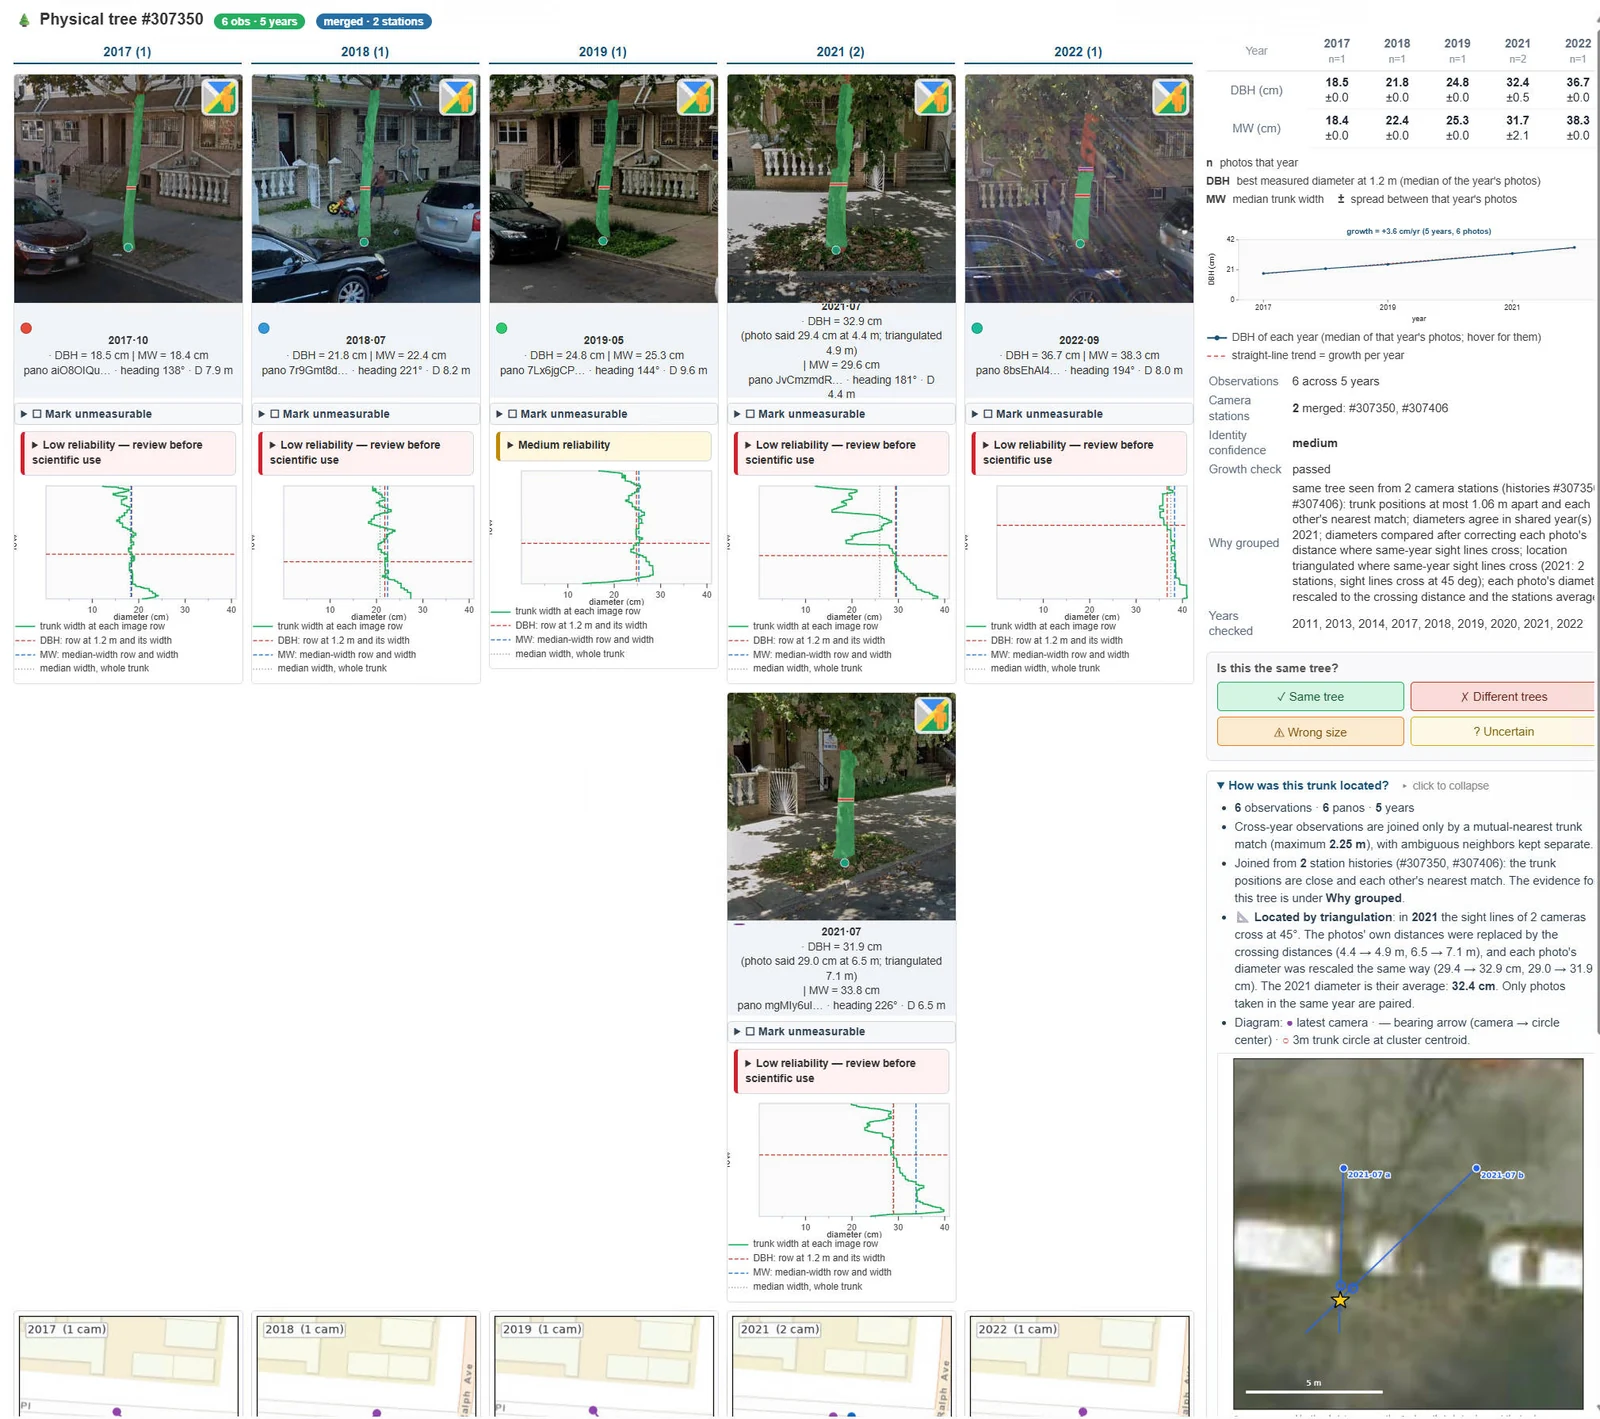
One street tree followed from 2017 to 2022: its trunk outline in each year’s photo, its diameter at breast height, the reliability of each reading, and its growth trend. Click the figure to enlarge it.
Challenges
Measurable tree selection. Many trunks in street view photos cannot be measured well. They hide behind cars or signs, fork or lean near breast height, do not visibly reach the ground, or stand too far from the camera. A trained classifier and geometric checks flag these photos, and a reviewer can mark a photo as unmeasurable so it drops out of that tree’s record.
Error assessment. A street tree grows only a few millimeters a year, so a small measurement error can hide the growth signal. We compare several ways of estimating the distance to each trunk, rate the reliability of every reading, check that each tree’s diameter changes plausibly over time, and validate the results against city tree inventories measured by hand.
Species detection. Growth rates differ among species, so a growth record is most useful when each tree’s species is known. Identifying species from street view photos, across seasons and camera generations, is the next step of this project.
Progress so far
The pipeline now runs in New York City and Atlanta. As of October 2026, it has processed more than 2.1 million street view panoramas in the two cities and grouped 1.3 million trunk measurements into about 295,000 physical trees. It is built to scale to any city with street view coverage.
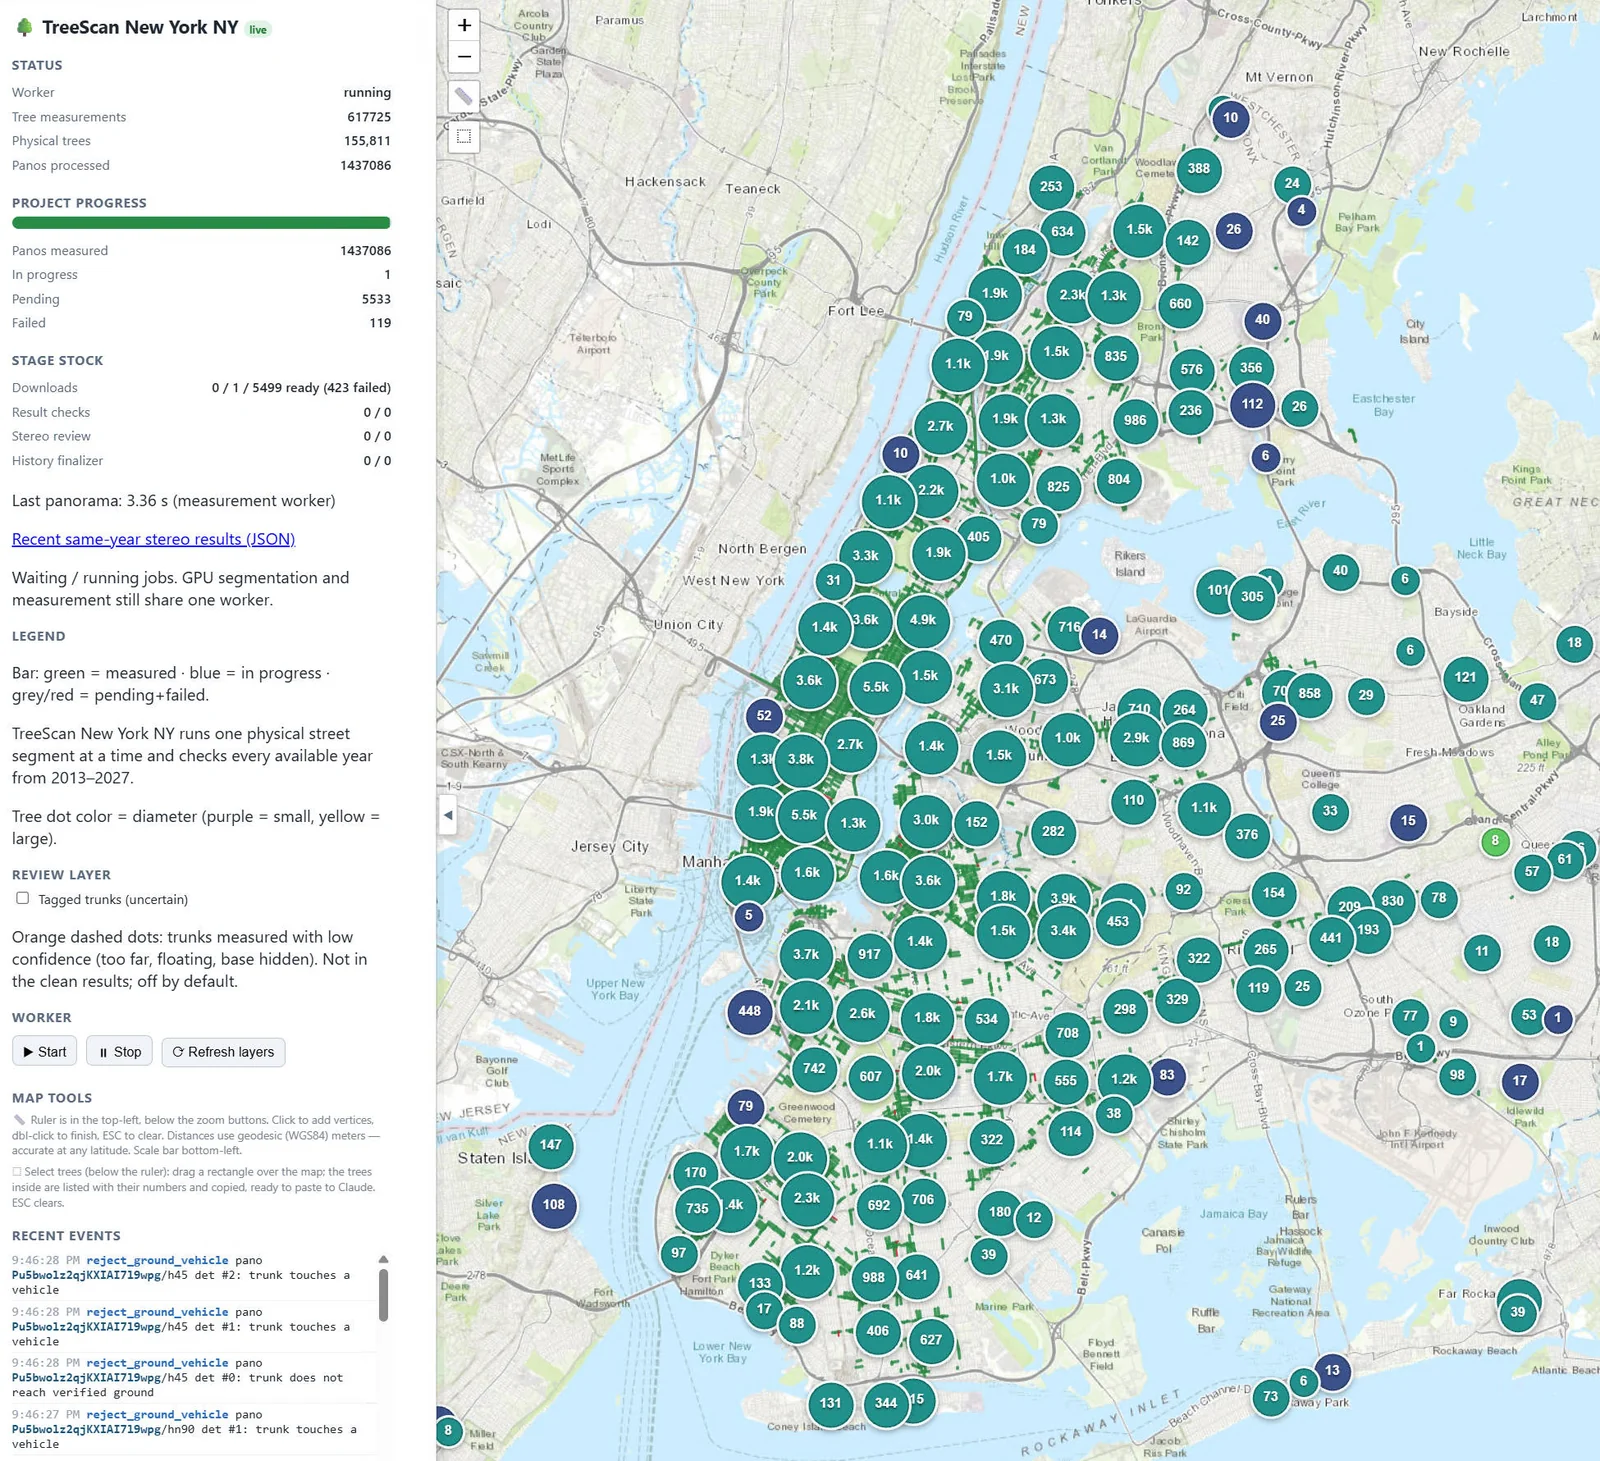
Citywide progress in New York City: 617,725 trunk measurements from 1.44 million panoramas, grouped into 155,811 physical trees. Each circle counts the trees measured in that area.
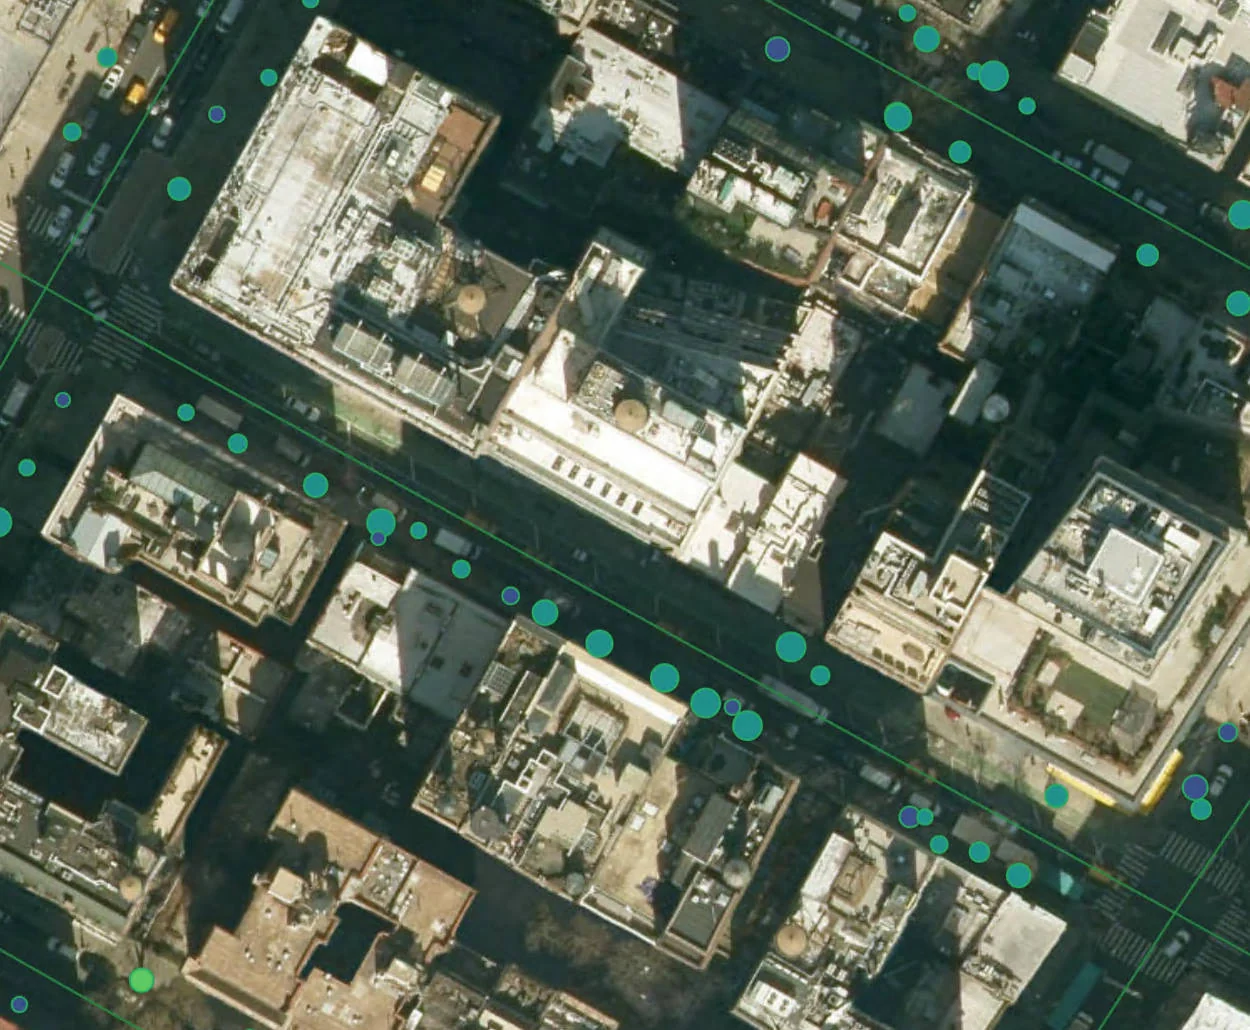
Measured trees along New York City streets on satellite imagery. Each dot is one physical tree, and its color shows the trunk diameter.
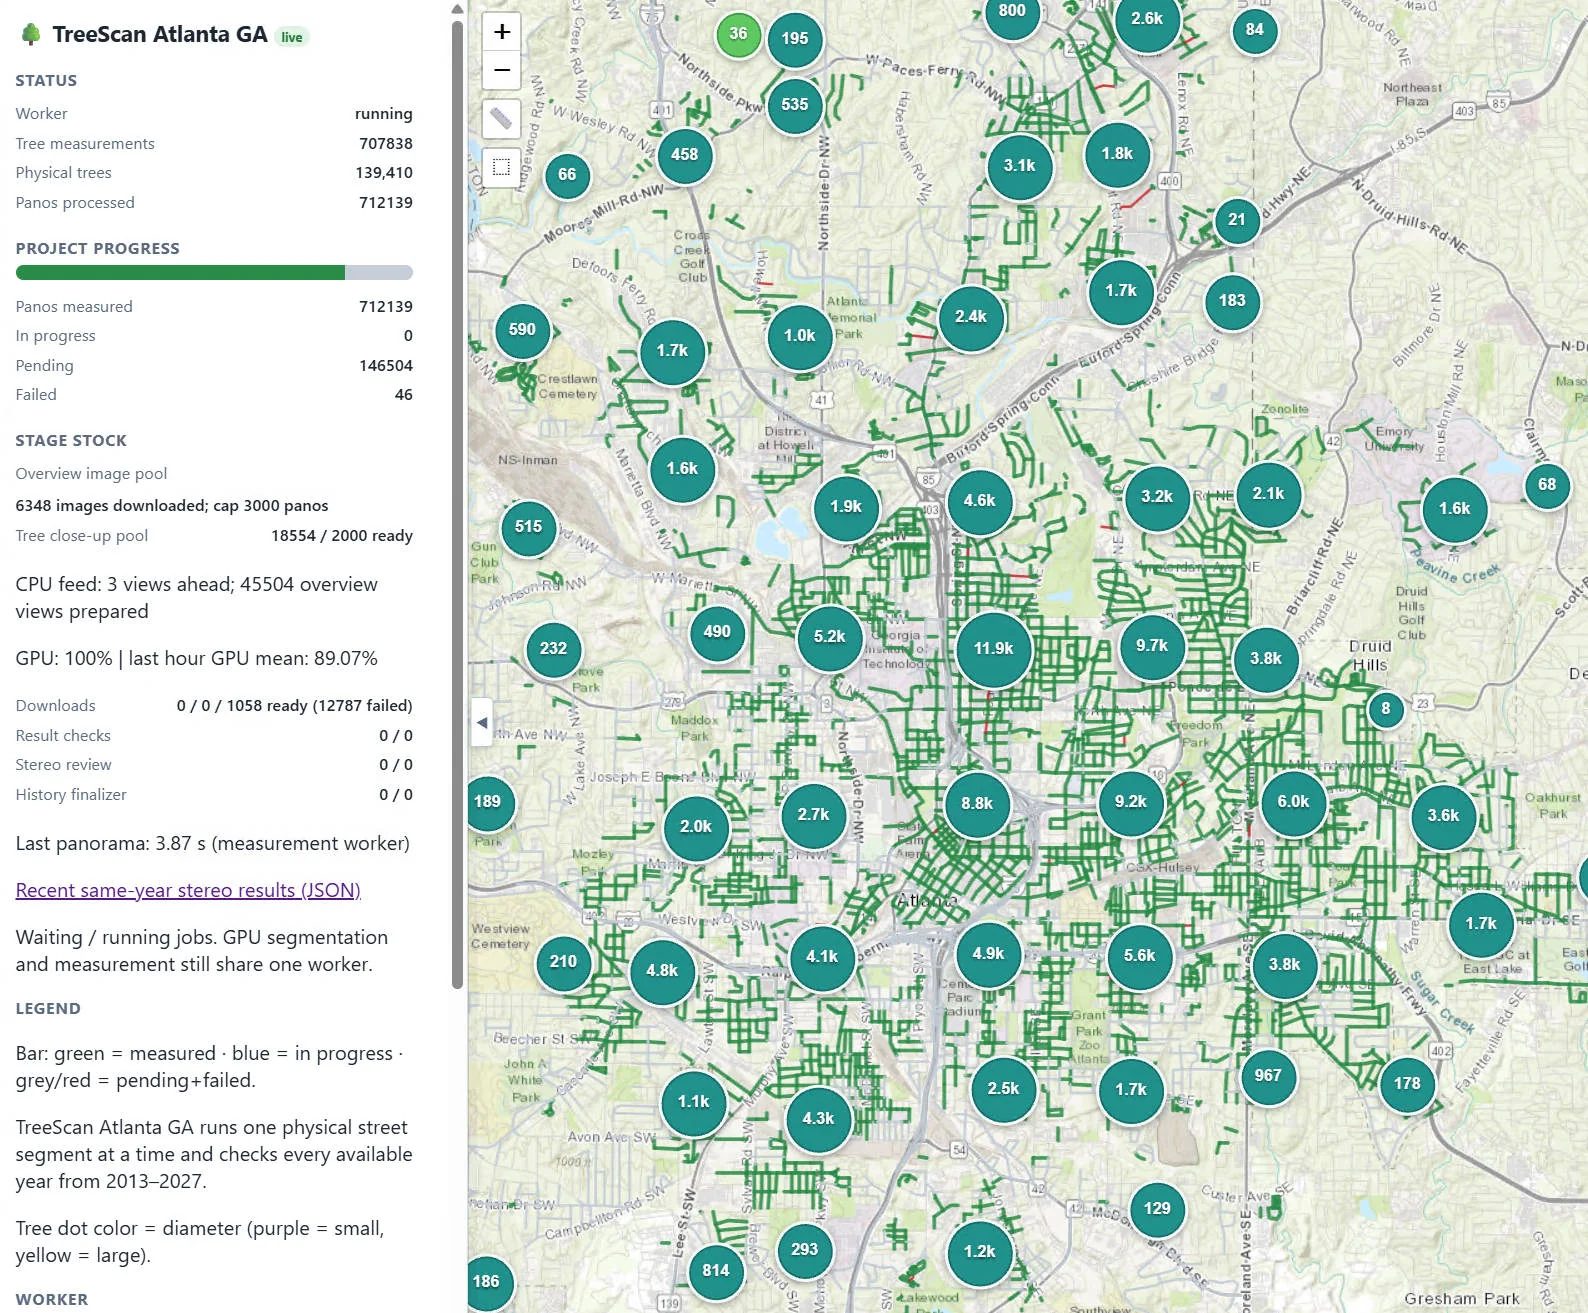
Citywide progress in Atlanta: 707,838 trunk measurements from 712,139 panoramas, grouped into 139,410 physical trees, with more streets still in the queue.